Introduction
My home network no longer exposes any ports thanks to tailscale. However, I have some services that family members need to access without tailscale. To support this I have a linode running tailscale + Caddy that proxies these requests to the home network.
I use UFW as the firewall on this linode and wanted a way to gain insights into how many, and what kind of requests it was blocking.
I already use a telegraf + influxdb + grafana monitoring stack so the goal was to integrate into that.
The result of this post can be found as part of the playbook found here
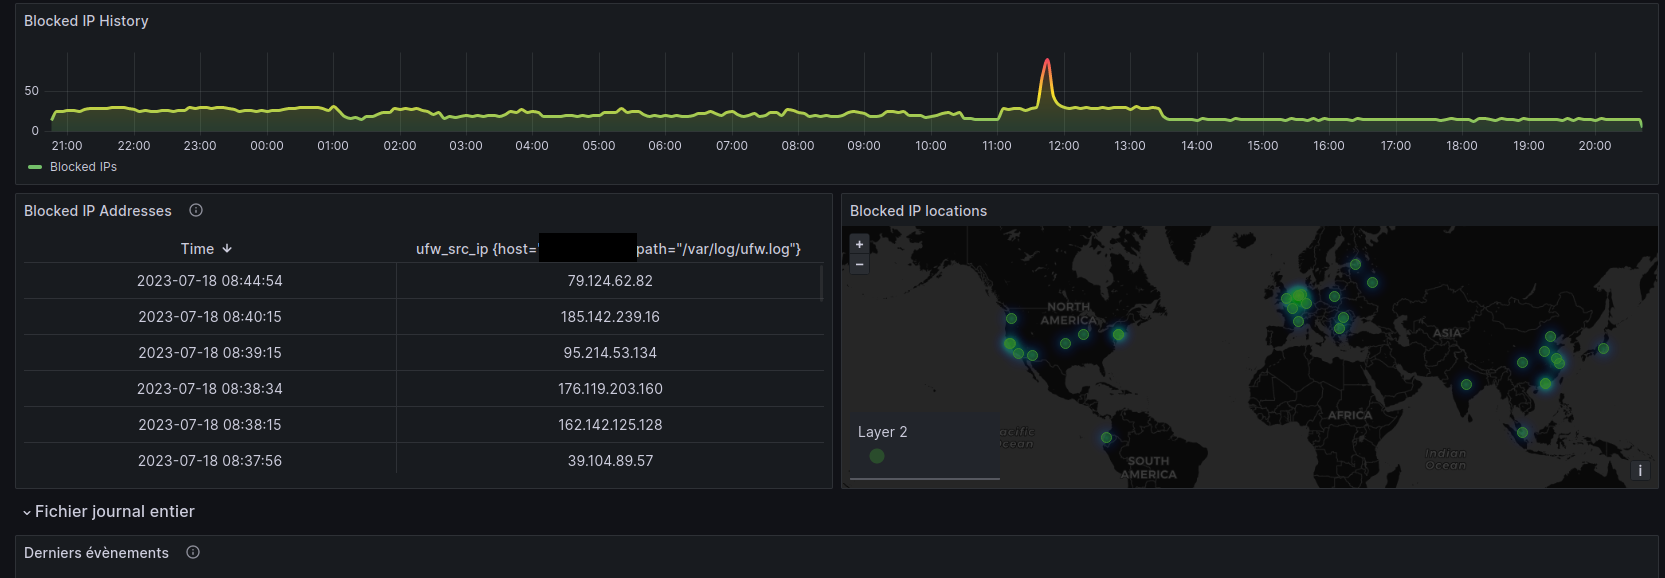
Here is a sample of what it will look like
Setup
My setup was inspired by this blog post. This is only available in French so I think it’s worth repeating some of the details.
Gather UFW statistics
UFW statistics can be gathered with the inputs.tail plugin of telegraf. Then the raw log can be parsed with grok before uploading into influx:
[[inputs.tail]]
    files = ["/var/log/ufw.log"]
    from_beginning = true
    name_override = "ufw_log"
    watch_method = "poll"
    grok_patterns = ["%{CUSTOM_LOG_FORMAT}"]
    grok_custom_patterns = '''
         CUSTOM_LOG_FORMAT %{SYSLOGTIMESTAMP:ufw_timestamp:ts-syslog} %{SYSLOGHOST:ufw_hostname} %{DATA:ufw_program}: \[%{DATA}\] \[UFW %{WORD:ufw_action}\] IN=%{DATA:ufw_interface} OUT=%{DATA:ufw_interface_out}( (MAC|PHYSIN)=%{DATA:ufw_mac})?SRC=%{IP:ufw_src_ip} DST=%{IP:ufw_dest_ip}( LEN=%{NUMBER:ufw_packet_len})? %{GREEDYDATA:ufw_tcp_opts} PROTO=%{WORD:ufw_protocol}( SPT=%{NUMBER:ufw_source_port})?( DPT=%{NUMBER:ufw_dest_port})?%{GREEDYDATA:ufw_tcp_opts}
    '''
    data_format = "grok"
    grok_timezone = "UTC"
    grok_custom_pattern_files = []
That looks like a mess but its straightforward once its broken down. The ufw log file is located at /var/log/ufw.log. We are going to watch that file and then parse the output using grok.
I lost a lot of time here. The ufw.log file may have unique permissions. On Ubuntu for instance its owned by user syslog and group adm. I added the telegraf user to the adm group so it could read this file.
The next thing to understand is the grok_custom_patterns. I had never heard of grok before but its basically a way to map custom regex’s onto variables. That long block is parsing the raw log file into structured input to be consumed by influxdb.
A great way to debug grok can be found here. The image below was generated on that site and shows how the log info from ufw.log looks after parsing to structured data.
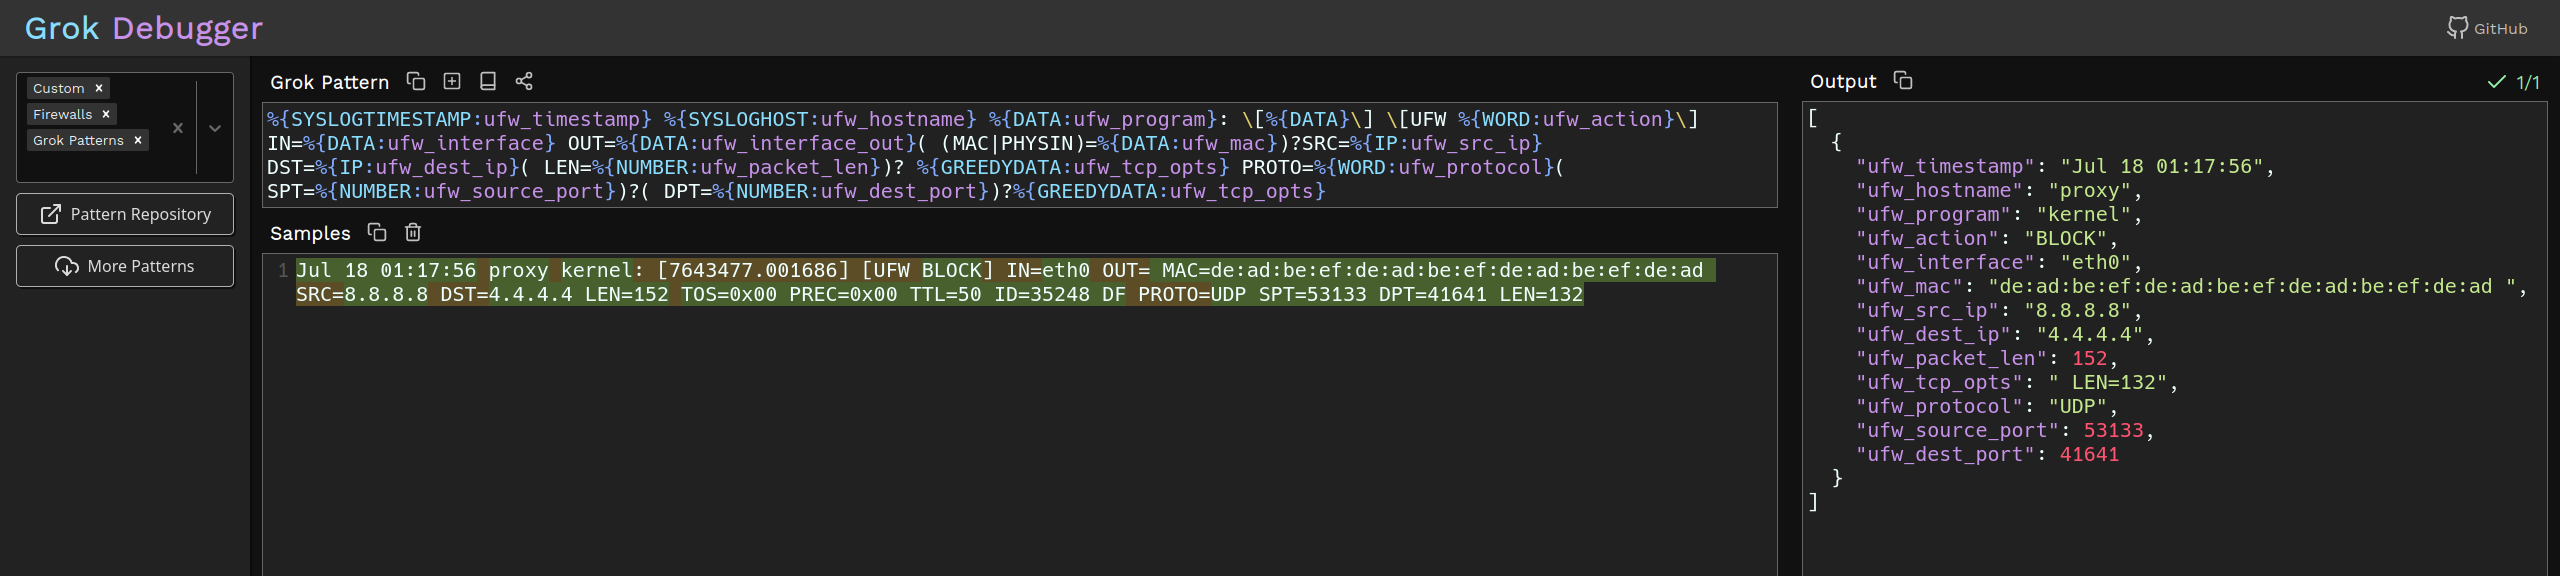
At this point the UFW logs will start to appear in influx db.
GeoIP Database
One cool thing about the dashboard in the original post was it mapped ip addresses to physical locations that could be drawn on a map. This was done using the MaxMind database..
You first need to register an account with MaxMind. Then login and click “Download Databases” and then download the “GeoLite2 City” database.
The ansible playbook takes care of installing this file.
Telegraf plugin
There is a telegraf plugin that will use the MindMax database to “insert” additional columns into influxdb containing the geo tags for each record. The ansible playbook takes care of building and installing this.
Then the main telegraf config file needs to have a processor plugin to actually run the geoip plugin:
[[processors.execd]]
  command = ["/usr/bin/geoip", "--config", "/etc/geoip/geoip.conf"]
I originally tried to have this additional processing done on a different server than the server running the UFW firewall. This does not seem to be possible. Make sure that the geoIP plugin is running on the same server as the UFW you want to monitor.
At this point I had had to troubleshoot telegraf a few times to fix various paper cuts (self documented in the ansible playbook) that its worth linking to this which gives a few tips on how to make telegraf more verbose for debugging purposes.
At this point your influxdb should show the original ufw log’s as well as associated geoip information.
Grafana setup
I did almost nothing to the grafana setup linked in the original blog post other than translate it to English and adjust the timezones.