Introduction
This post will explain how I’ve setup Telegraf, InfluxDB, and Grafana for monitoring self hosted services. All of this is deployed with an Ansible playbook that can be found on github
Telegraf
Telegraf will need to run on each VM or host that needs monitoring. This is the agent that monitors, aggregate, and reports data. Each agent needs to be configured through the telegraf.conf file to configure where the data should be sent, and what should be collected.
InfluxDB
InfluxDB is a time series database. This will be used to store and query all the reported data.
Grafana
Grafana is used to make dashboards to visualize all the data that is queried from InfluxDB. We will also use it for triggering alerts.
To recap what the setup will look like see the diagram below:

Configuring Telegraf
There are 3 main things that need to be configured in the telegraf.conf file, general settings, output plugins, and input plugins.
All snipped below are taken from the (ansible template)[https://github.com/borgmanJeremy/tig_stack/blob/main/roles/telegraf/templates/telegraf.conf.j2]
General settings
The import things in this stanza to change are the time zone and default interval you want data collected.
[global_tags]
[agent]
  interval = "10s"
  round_interval = true
  metric_batch_size = 1000
  metric_buffer_limit = 10000
  collection_jitter = "0s"

  flush_interval = "10s"
  flush_jitter = "0s"

  precision = "0s"

  # debug = false
  ## Log only error level messages.
  # quiet = false

  ## Log target controls the destination for logs and can be one of "file",
  ## "stderr" or, on Windows, "eventlog".  When set to "file", the output file
  ## is determined by the "logfile" setting.
  # logtarget = "file"

  ## Name of the file to be logged to when using the "file" logtarget.  If set to
  ## the empty string then logs are written to stderr.
  # logfile = ""

  ## The logfile will be rotated after the time interval specified.  When set
  ## to 0 no time based rotation is performed.  Logs are rotated only when
  ## written to, if there is no log activity rotation may be delayed.
  # logfile_rotation_interval = "0h"

  ## The logfile will be rotated when it becomes larger than the specified
  ## size.  When set to 0 no size based rotation is performed.
  # logfile_rotation_max_size = "0MB"
  ## Pick a timezone to use when logging or type 'local' for local time.
  ## Example: America/Chicago
  # log_with_timezone = ""

  ## Override default hostname, if empty use os.Hostname()
  hostname = ""
  ## If set to true, do no set the "host" tag in the telegraf agent.
  omit_hostname = false
  ...
  ...
Output Plugins
This is where we tell telegraf how to connect to our InfluxDB server. Since this is manage with ansible it is using variables that are defined in the variables. However, its pretty straightforward to manually fill in the details if needed.
...
...
# Configuration for sending metrics to InfluxDB 2.0
[[outputs.influxdb_v2]]
  urls = ["http://{{ influx_ip_address }}:8086"]
  token = "{{ influx_token  }}"
  organization = "{{ influx_org_name }}"
  bucket = "{{  influx_bucket_name }}"
  ...
  ...
Input Plugins
This section is truncated due to length. The general idea each item that should be monitored should be behind an ansible flag so a given host can opt in our opt out. For a comprehensive overview of input plugins reference the telegraf documentation
...
...
{% if monitor_system  %}
# Read metrics about cpu usage
[[inputs.cpu]]
  ## Whether to report per-cpu stats or not
  percpu = true
  ## Whether to report total system cpu stats or not
  totalcpu = true
  ## If true, collect raw CPU time metrics
  collect_cpu_time = false
  ## If true, compute and report the sum of all non-idle CPU states
  report_active = false
  ## If true and the info is available then add core_id and physical_id tags
  core_tags = false

[[inputs.kernel]]

[[inputs.mem]]
{% endif %}
One really neat thing about telegraf is it can ingest nagios logs. This makes integrating sanoid health checks a breeze.
...
...
{% if monitor_sanoid_snapshots %}
[[inputs.exec]]
  commands = ["sudo /usr/sbin/sanoid  --monitor-snapshots"]
  interval = "4h"
  data_format = "nagios"
  name_suffix = "_snapshot_health"
{% endif %}


{% if monitor_sanoid_health %}
[[inputs.exec]]
  collection_jitter = "2m"
  commands = ["sudo /usr/sbin/sanoid  --monitor-health"]
  interval = "4h"
  data_format = "nagios"
  name_suffix = "_snapshot_health"
{% endif %}
Configuring InfluxDB
The ansible playbook fully installs InfluxDB and provisions the database. It of course can be run manually by substituting in the variables.
- name: setup influx
  command: influx setup -b {{ influx_bucket_name }} -o {{ influx_org_name }} -u {{ influx_user_name }} -p {{ influx_password }}  -t {{ influx_token }} -r 0 -f
  ignore_errors: true
Once this is provisioned you can log into the influx dashboard and use the data explorer to start looking at the data coming in from the telegraf agents.
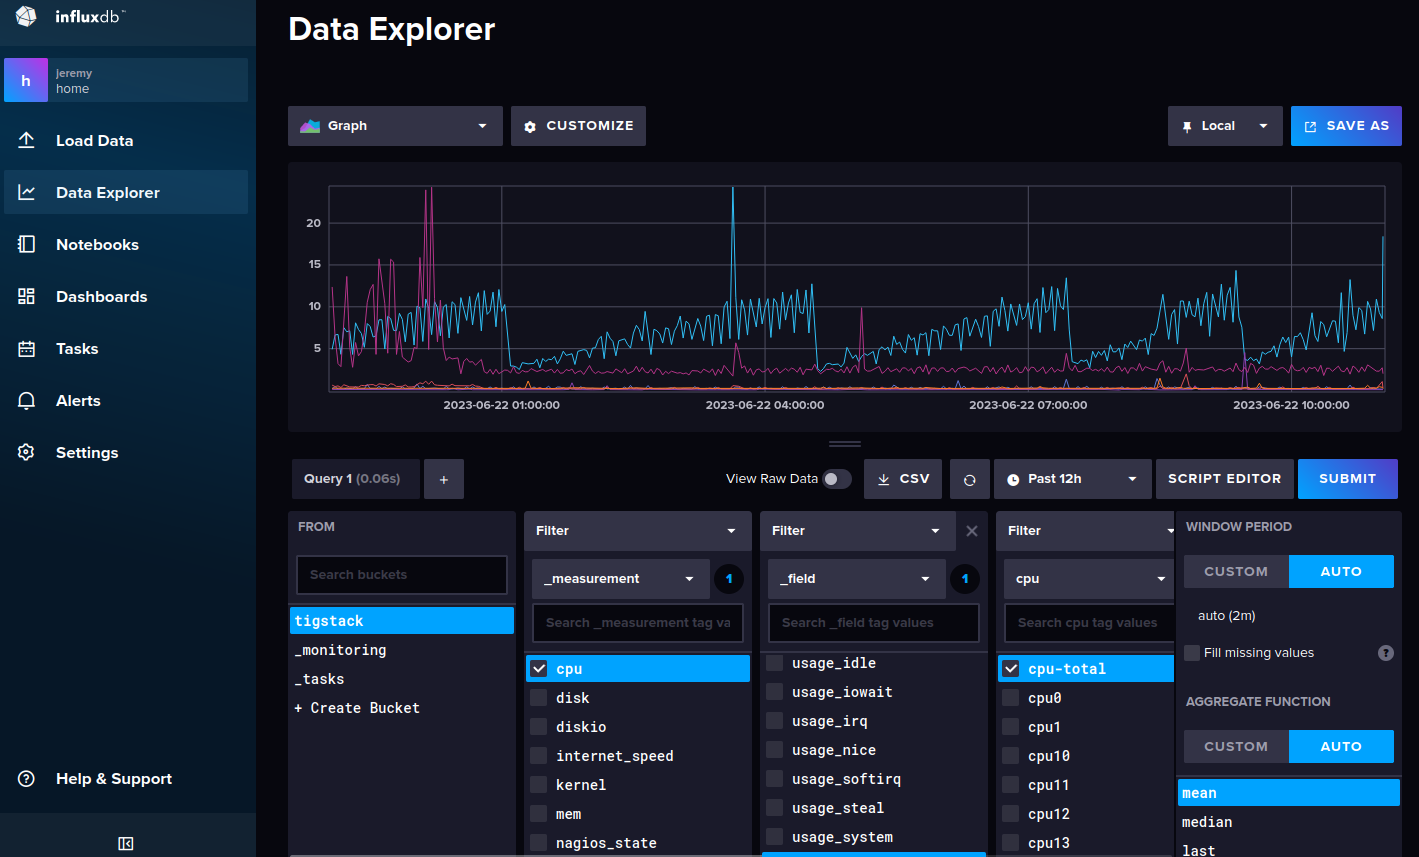
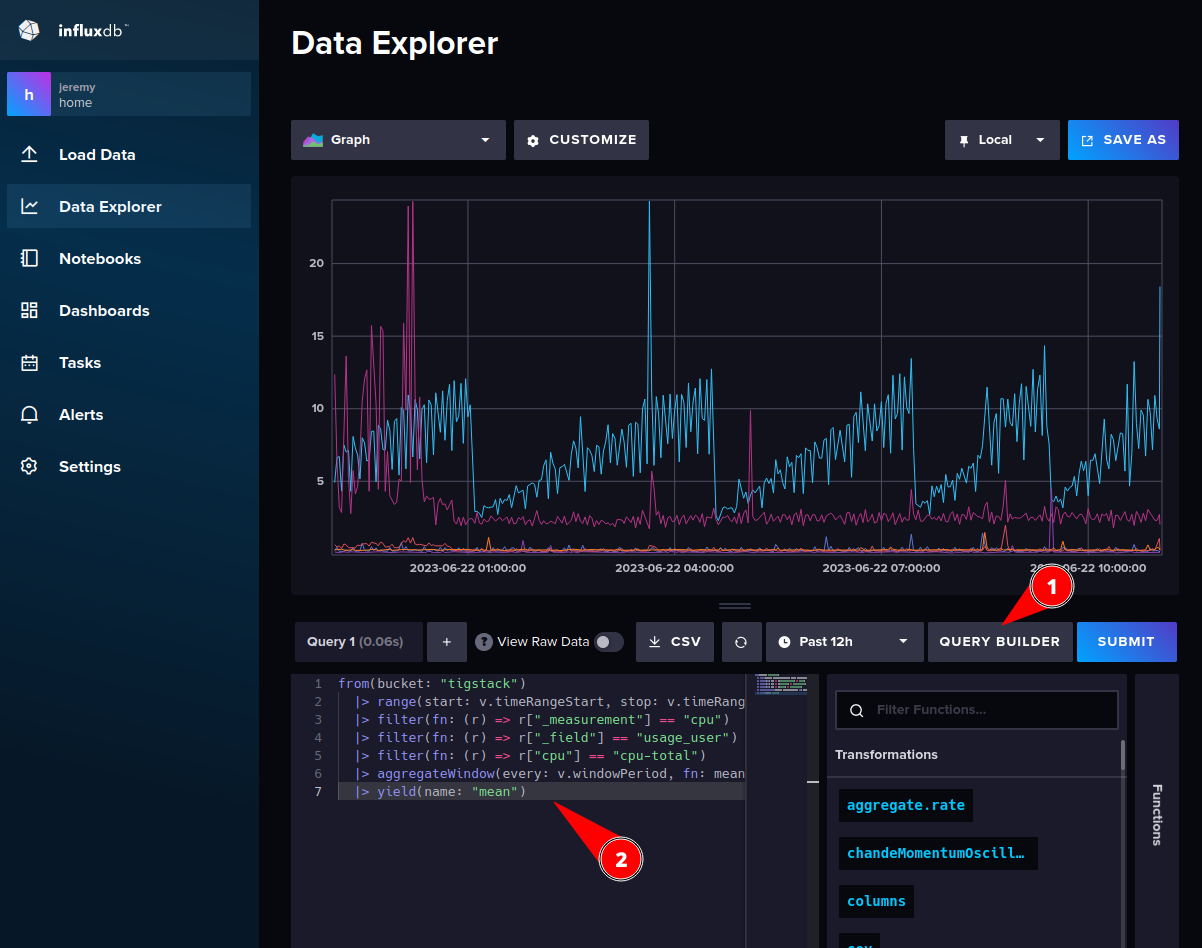
If you click “Script Editor” you see the exact query that is submitted to generate the plot. This can be handy for preparing the queries for Grafana.
Configuring Grafana
Dashboards
The ansible playbook will provision grafana. It’s possible that one could create an ansible template for the grafana dashboard json file, but in practice I have found it’s easier to create the dashboard right in grafana and then just back up the backing json file.
Before we can plot data from InfluxDB it needs to be connected.
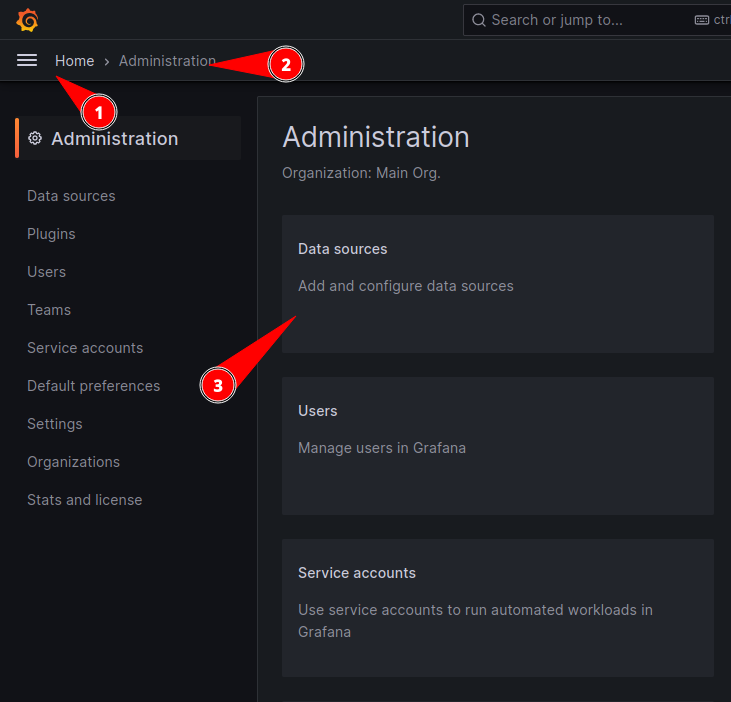
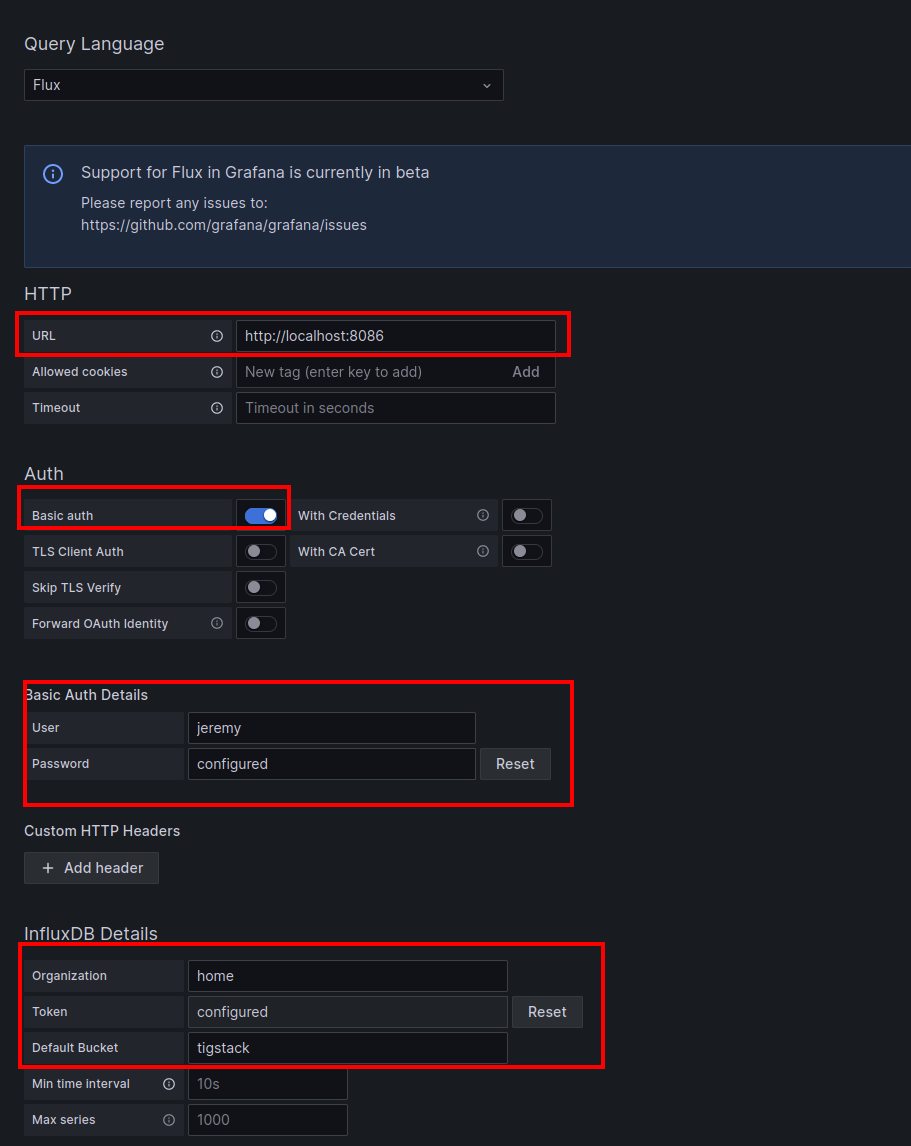
Then click “+Add new data source” and search for InfluxDB. Configure the HTTP URL, set the authentication to basic auth, enter in the credentials, and enter in the DB details.
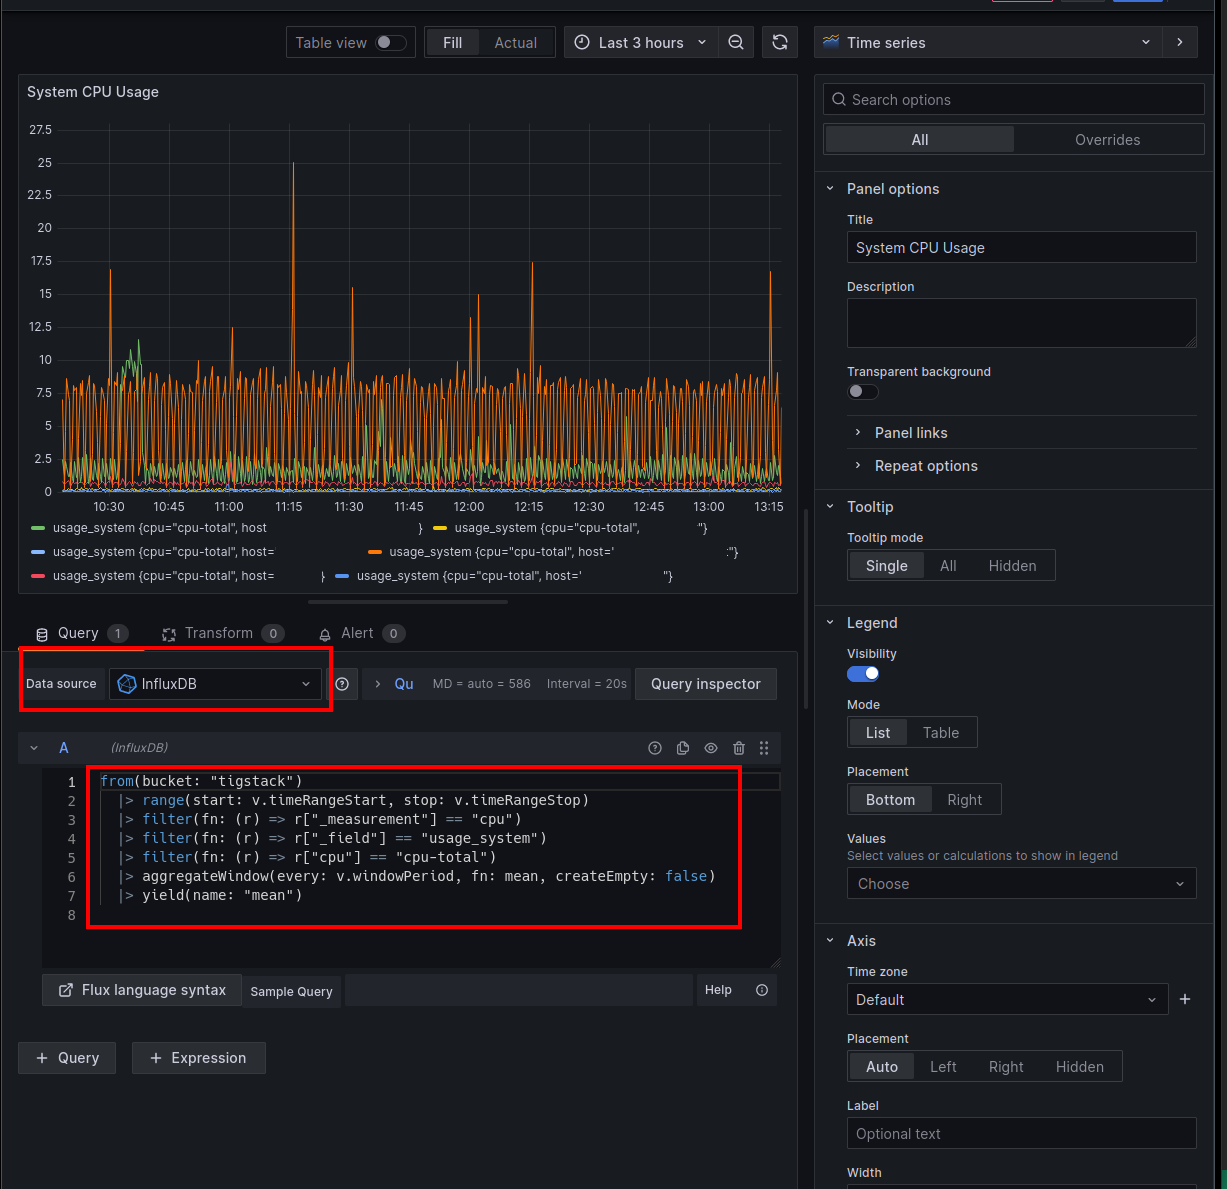
Here is one example of how to add a plot in grafana that connects to InfluxDB. Here is where it is handy to first prepare the query in the InfluxDB web interface and then copy and paste the query to grafana.
Monitoring
The last thing that needs to be configured in grafana is monitoring and reporting.
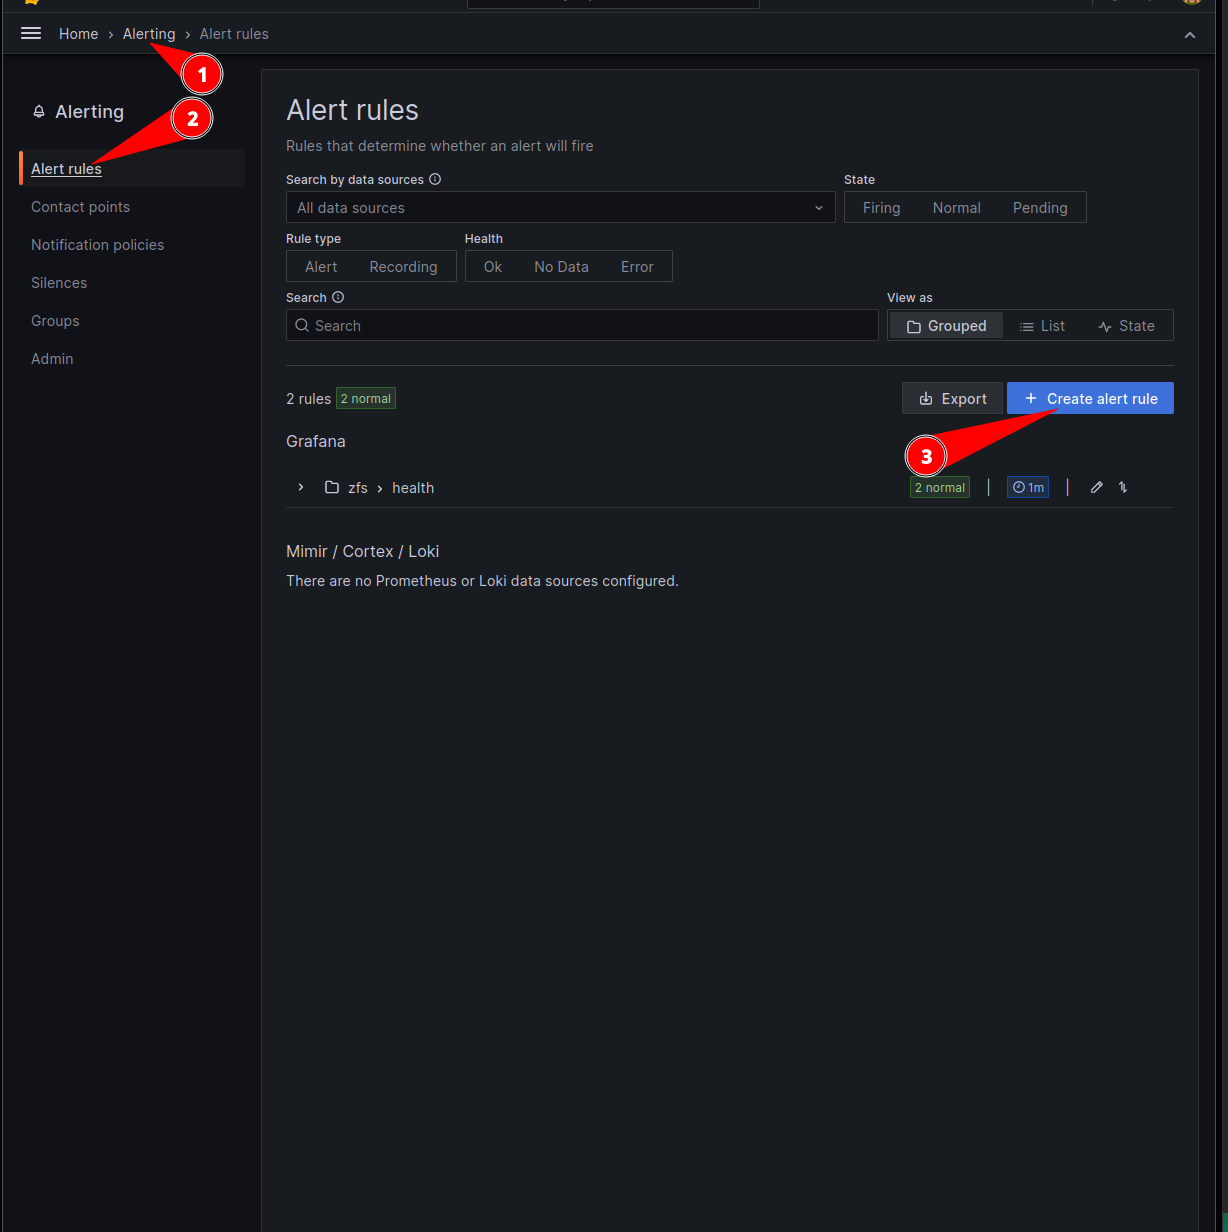
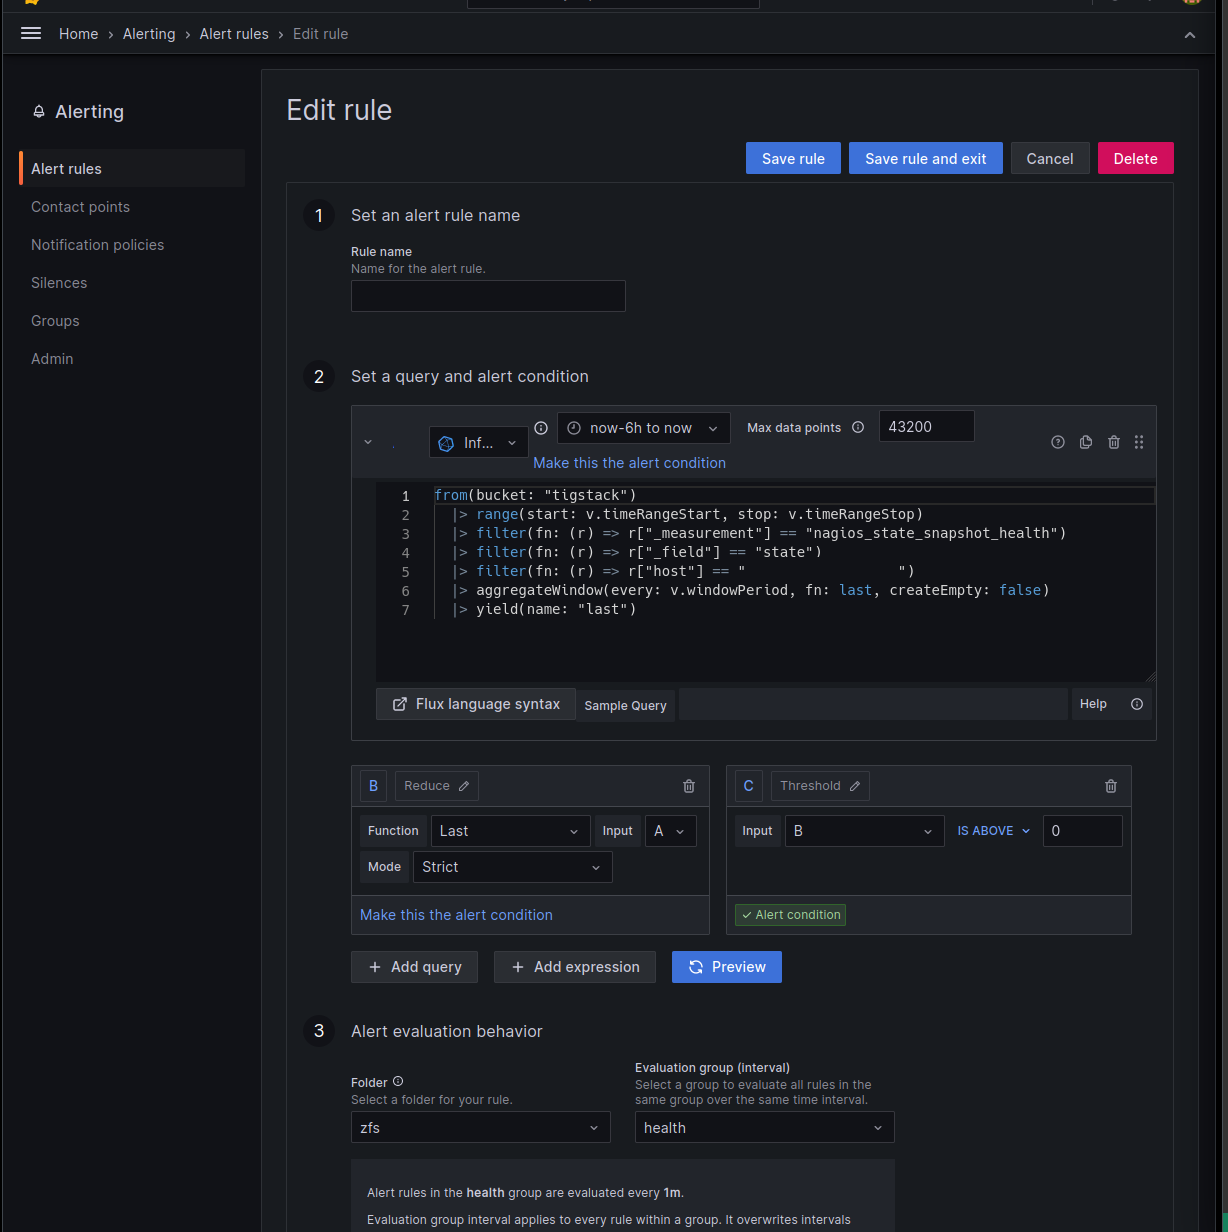
The below example sets up an alert if the health reported by sanoid is not passing.
One can set up notifications as well through the notification policy page. I am using pushover for mobile push notifications, but this will be very user specific so will not be covered in detail.