Introduction
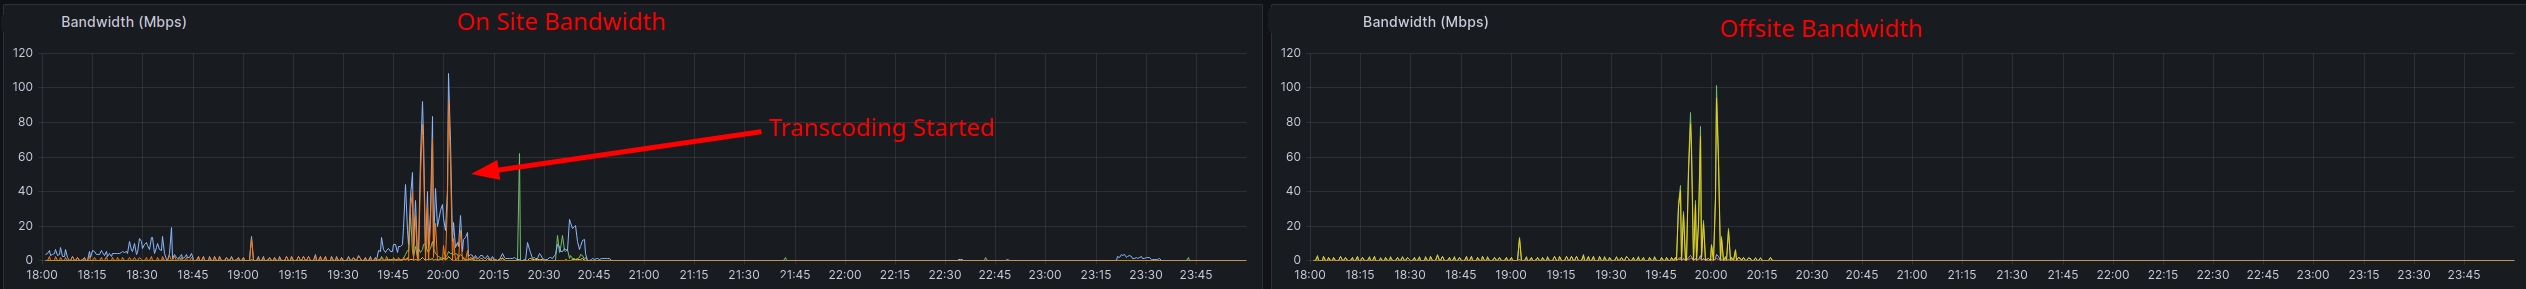
I noticed strange some strange behavior when looking through my grafana dashboard. Every time I watched a video in Jellyfin that required transcoding, I saw a large spike in bandwidth to my offsite zfs backup. There are also smaller bandwidth spikes about every two minutes.
Debugging
Syncoid Backups
The first thing I did to debug this was remote into the offsite backup and use nethogs to see what was using the bandwidth. I saw that all the bandwidth was coming from the tailscale process. Due to the way my networking on the remote machine is setup, I was pretty confident that this must be related to my zfs syncoid backups.
I ssh’ed into the main server and checked out the logs related to the backup service.
sudo journalctl --since "12 hour ago" -u backup.service
Jul 16 09:32:47 server systemd[1]: backup.service: Deactivated successfully.
Jul 16 09:32:47 server systemd[1]: backup.service: Consumed 2.574s CPU time.
Jul 16 09:33:17 server systemd[1]: backup.service: Scheduled restart job, restart counter is at 1>
Jul 16 09:33:17 server systemd[1]: Stopped Run zfs.rent Job.
Jul 16 09:33:17 server systemd[1]: backup.service: Consumed 2.574s CPU time.
Jul 16 09:33:17 server systemd[1]: Started Run zfs.rent Job.

...
...
...

Jul 16 09:34:31 server systemd[1]: backup.service: Deactivated successfully.
Jul 16 09:34:31 server systemd[1]: backup.service: Consumed 2.560s CPU time.
Jul 16 09:35:02 server systemd[1]: backup.service: Scheduled restart job, restart counter is at 1>
Jul 16 09:35:02 server systemd[1]: Stopped Run zfs.rent Job.
Jul 16 09:35:02 server systemd[1]: backup.service: Consumed 2.560s CPU time.
Jul 16 09:35:02 server systemd[1]: Started Run zfs.rent Job.
Interesting! About 30 seconds after the previous job completes, a new one starts. I have a systemd timer managing this service so I looked at that file.
jeremy@server ~> cat /etc/systemd/system/backup.timer
[Unit]
Description=Run zfs.rent service

[Timer]
OnUnitActiveSec=12h

[Install]
WantedBy=backup.target
That matches the behavior I want to see, every 12 hours I want to offload to my offsite backup. Next I checked the systemd service file for the backup service.
jeremy@server ~> cat /etc/systemd/system/backup.service
[Unit]
Description=Run zfs.rent Job
After=zfs-mount.service
After=network.service

[Service]
ExecStart=/home/jeremy/backup.sh
User=jeremy
Restart=always
RestartSec=30

[Install]
WantedBy=multi-user.target
RestartSec=30 caught my attention. When I originally wrote this file I thought this meant that if and only if the script failed, it should be restarted 30 seconds later. I checked the documentation
Pasted from the docs:
RestartSec=
Configures the time to sleep before restarting a service (as configured with Restart=). Takes a unit-less value in seconds, or a time span value such as “5min 20s”. Defaults to 100ms.
Restart=
… If set to on-failure, the service will be restarted when the process exits with a non-zero exit code, is terminated by a signal (including on core dump, but excluding the aforementioned four signals), when an operation (such as service reload) times out, and when the configured watchdog timeout is triggered. If set to on-abnormal, the service will be restarted when the process is terminated by a signal (including on core dump, excluding the aforementioned four signals), when an operation times out, or when the watchdog timeout is triggered. If set to on-abort, the service will be restarted only if the service process exits due to an uncaught signal not specified as a clean exit status. If set to on-watchdog, the service will be restarted only if the watchdog timeout for the service expires. If set to always, the service will be restarted regardless of whether it exited cleanly or not, got terminated abnormally by a signal, or hit a timeout.
Oops….This means that the systemd service is always going to start 30 seconds after it successfully finishes.
Jellyfin Caching
This explains why there is constant bandwidth between the main server and the remote. However it does not explain why there is a large spike in bandwidth when Jellyfin is transcoding. Now that we know the bandwidth was generally related to the constant offloading, we know we can basically look for why Jellyfin has high write IO to disk during transcoding.
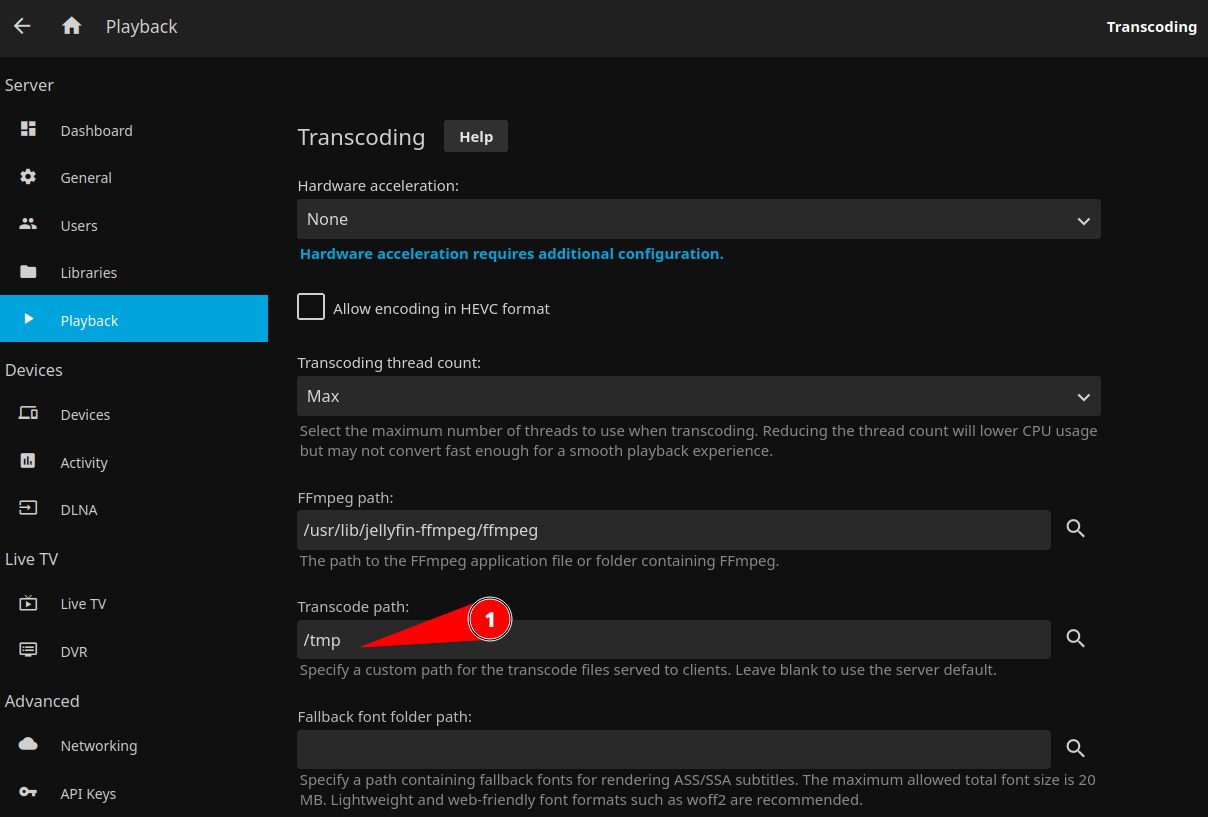
The first thing I checked was the transcode settings in jellyfin and the mistake was immediately obvious. The transcode path was set to a path that is volume mounted to my zfs pool. I fixed this by passing in a tmpfs volume to the container and setting the transcode path to use that folder:
version: "3.0"
services:
  jellyfin:
    image: linuxserver/jellyfin
    container_name: jellyfin
    environment:
      - PUID=1000
      - PGID=1000
      - TZ=America/Chicago
    ports:
      - 8096:8096
    deploy:
      resources:
        reservations:
          devices:
            - driver: nvidia
              count: 1
              capabilities: [gpu]
    volumes:
        ... elided for brevity ...

      - type: tmpfs
        target: /tmp:exec
    restart: unless-stopped